

Announcements
Announcements
The development finance architecture is notoriously complex, and the available data is not easy to use. A new SEI tool will visualize aid flows interactively, allowing users to discover how much finance is provided, where it comes from, where it goes, and what it is being used for.
Visualization of development finance flows (prototype).
Every year, around US$146 billion flows from major donors to help poorer countries finance their development. This support can be critical, especially for the world’s poorest countries. But there are legitimate questions about how it is targeted and how it is being spent.
Answering these questions can be difficult. Development finance flows through a complex, opaque and political architecture linking donors, multilateral funds, development banks, development agencies, international NGOs and recipient country governments.
The OECD compiles a relatively comprehensive set of international development finance data, reported by the donors themselves, and makes it freely available. But to date this data has been difficult and time-consuming to use without expert help.
From later this year, users will be able to explore the OECD data much more easily using an open-access online platform being developed by SEI. The platform will visualize how much official development finance flows from each donor (countries, development banks, philanthropic funds and more) to each recipient country, and what sectors it is destined for. Interactive filters will allow users to look at data for different years and to zoom in on the flows they are interested in.
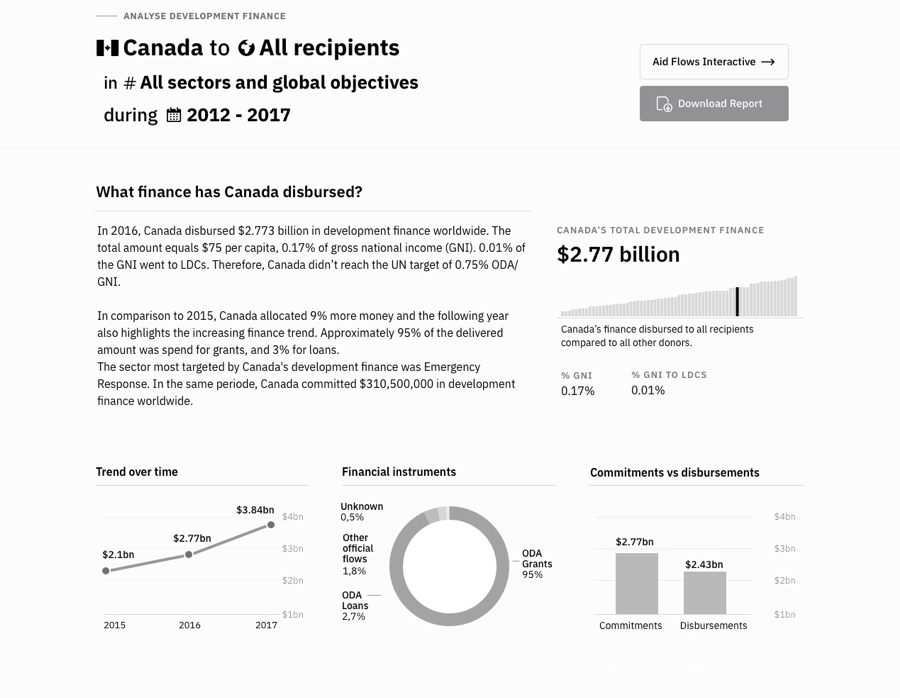
Country profile page for Canada
Users will also be able to dive deeper by accessing summary profile pages for individual donors and recipients, as well as sectors and policy objectives. These will provide additional information such as aid per capita or gross national income, how donors’ actual disbursements match up to their commitments, and trends over time.
Users will be able to download these summary reports in PDF format.
SEI’s hope is that the new platform will transform our understanding of the way development finance is working, by increasing the transparency and usability of the available data. It can also be an invaluable tool in investigating what impacts development finance is having.

Disbursement of development finance from Canada by sector (2017)
In addition, making the data easier to use could spur donors to improve the quality of their reporting on development finance, in order to better demonstrate to their citizens and to the international community the support they have been providing. Today, the OECD data is variable in quality and the level of disaggregation.
Ultimately, the platform aims to help improve the effectiveness of development finance, by making it easier to see gaps, identify where finance is or is not making a difference, and highlight opportunities for coordination.
The platform is scheduled for launch in November 2019. The vision is then to keeping adding more financial flows as well as socio-economic indicators (such as Sustainable Development Goal indicators), making it even easier to see where development finance is working – and where more might be needed.
SEI working paper / Climate vulnerability is only attractive to donors up to a point. This study shows that vulnerable nations are not the most likely to get adaptation funding.
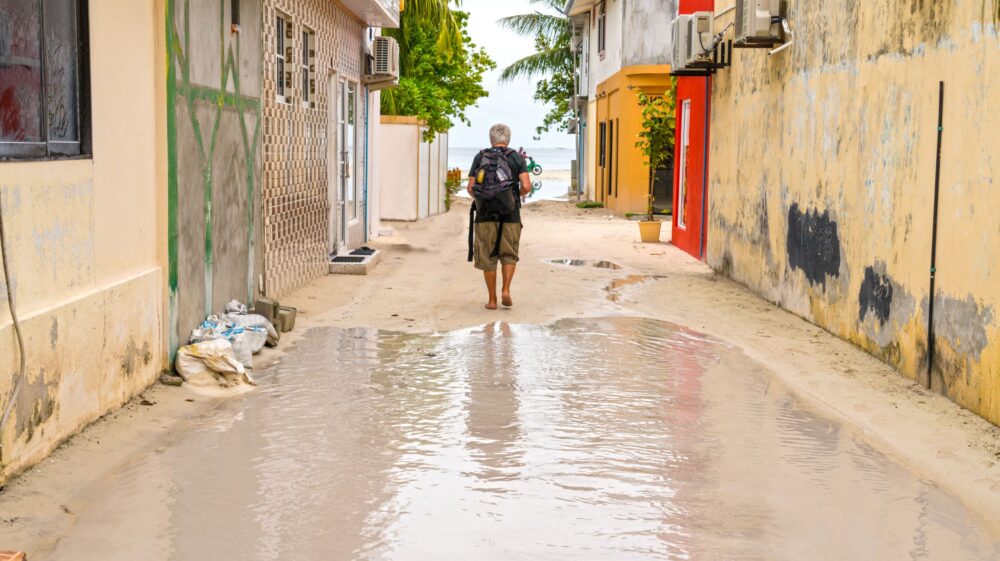
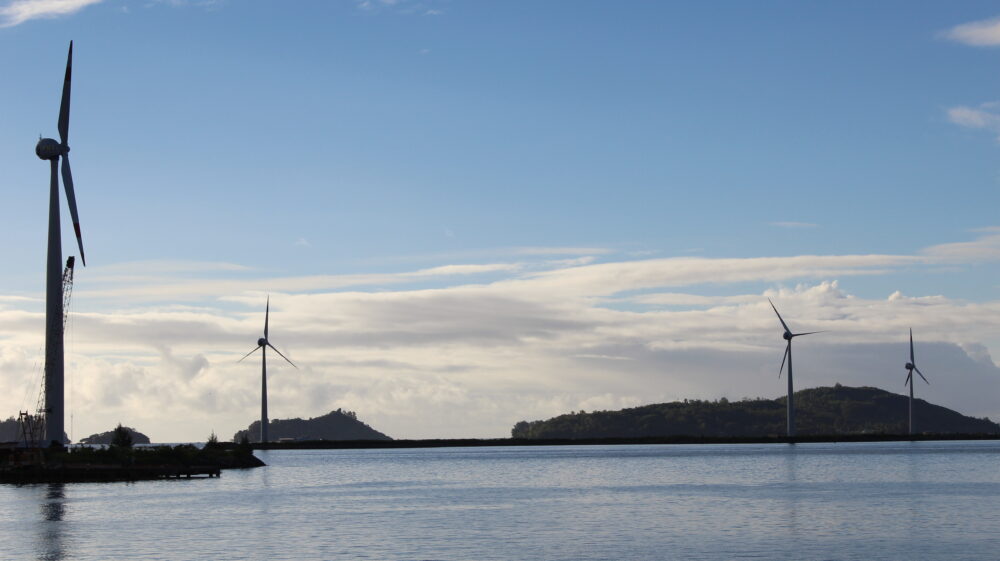
Feature / Despite donors committing increasing amounts of money to develop renewable energy in small island developing states, not all of it is being disbursed. Why?
Other publication / This working paper outlines key features of the global climate finance landscape, including the potential for overlapping actions and coordination challenges.
Design and development by Soapbox.