


Announcements
Announcements
This Excel-based tool allows users to explore the inequalities in CO2 emissions across the world, by linking emissions to income levels.
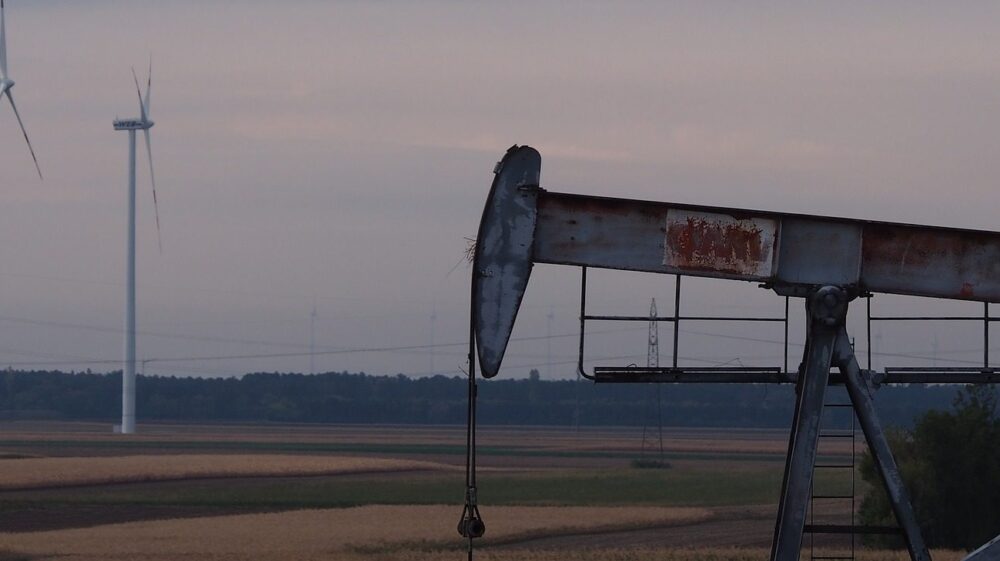
Photo: jpgfactory / Getty Images.
The Emissions Inequality Dashboard looks at the global emissions distribution across income groups for 1990 through 2015. To do this, it combines global and national income inequality data with national consumption emissions from 117 countries. Future scenarios of carbon inequality are also shown, based on various possible trajectories of economic growth and carbon emissions. This is used to demonstrate how different income groups contribute to the global carbon budget, and to assess the remaining number of years before the carbon budget is diminished under different scenarios.
Other publication / This paper draws on new data examining the starkly different global distribution of carbon consumption emissions among individuals from 1990 to 2015 and beyond.
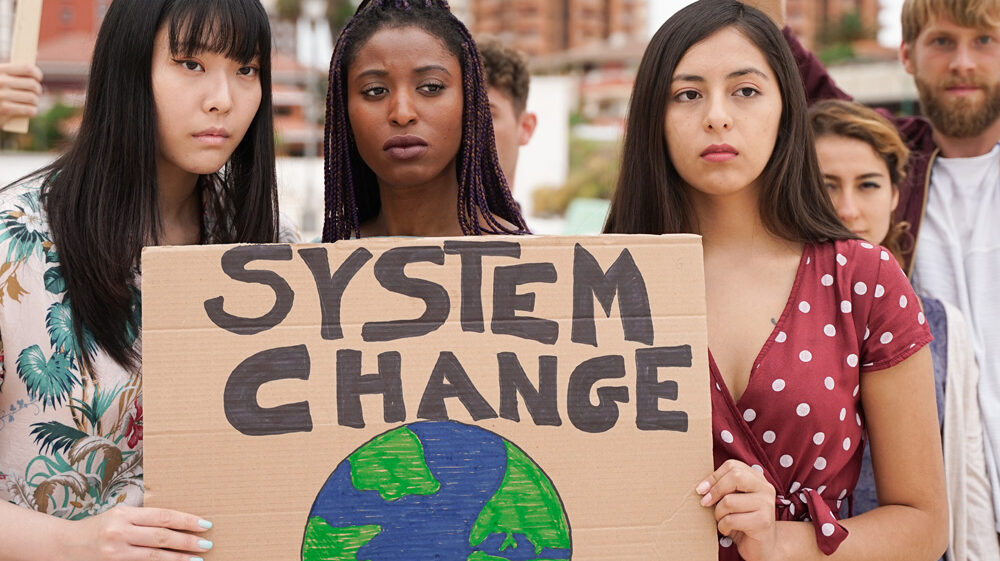
This program aims to contribute to a successful sustainability transition by promoting solutions perceived as fair and equitable.
Perspective / Staying within climate limits requires restricting fossil fuel extraction as well as demand. But where and how should it be restricted?
Feature / SEI experts make recommendations for a sustainable recovery, focusing on policies to promote equity, resilience and green growth.
Design and development by Soapbox.